| Concept | Description |
|---|---|
| The Five Types | |
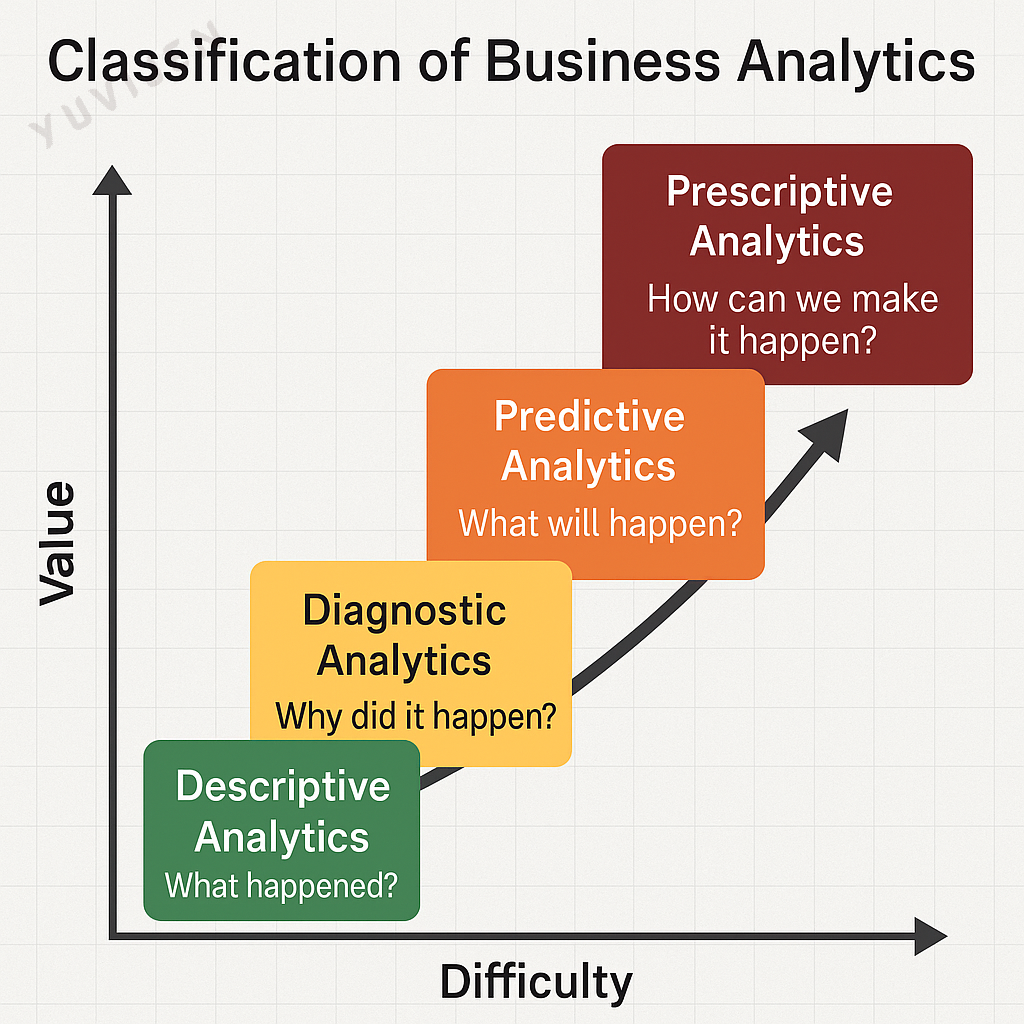
| Descriptive Analytics | Summarises historical data to explain what happened through aggregation, visualisation, and reporting |
| Diagnostic Analytics | Drills into past performance to explain why an outcome occurred using correlation, segmentation, and root-cause methods |
| Predictive Analytics | Uses statistical models and machine learning on historical data to forecast future events and behaviours |
| Prescriptive Analytics | Combines predictions, constraints, and optimisation to recommend the best action for a defined objective |
| Cognitive Analytics | Mimics human reasoning using AI, NLP, and machine learning to interpret complex, often unstructured information |
| Descriptive Techniques | |
| Data Aggregation | Combines data from multiple sources into a unified dataset ready for analysis |
| Trend and Pattern Identification | Detects recurring patterns, seasonality, and shifts in time-series and categorical data |
| Reporting and Dashboards | Communicates insights through Power BI, Tableau, Excel, or R Shiny dashboards |
| Diagnostic Techniques | |
| Drill-Down Analysis | Breaks high-level metrics into finer slices (region, product, period) to locate the source of change |
| Anomaly Detection | Statistical and machine learning methods that flag values and behaviours deviating from expectation |
| Hypothesis Testing | Tests analyst hypotheses using t-tests, ANOVA, chi-square, and similar procedures |
| Root Cause Analysis | Applies 5 Whys, Ishikawa, or Pareto to isolate the fundamental driver of an issue |
| Predictive Techniques | |
| Regression and Classification | Predicts continuous and categorical outcomes using linear, logistic, tree, and forest models |
| Time Series Forecasting | Forecasts values across time using ARIMA, exponential smoothing, and Prophet |
| Neural Networks and Deep Learning | Models complex non-linear relationships in large datasets for image, voice, and text tasks |
| Prescriptive Techniques | |
| Optimization Algorithms | Linear, integer, and nonlinear programming to select the best option under constraints |
| Simulation Modeling | Monte Carlo and discrete-event simulation to evaluate decisions under uncertainty |
| Decision Analysis | Decision trees, influence diagrams, and utility theory to quantify trade-offs |
| Scenario and What-If Analysis | Tests hypothetical situations to see how input changes affect outcomes and risks |
| Cognitive Techniques | |
| Natural Language Processing | Extracts intent, sentiment, and meaning from unstructured text, speech, and documents |
| Knowledge Representation | Uses knowledge graphs and ontologies so systems can reason over domain knowledge |
| Context-Aware Computing | Factors in user, time, and environment context to make outputs more relevant |
| Continuous Learning | Updates models on new inputs and feedback so cognitive systems adapt over time |
3 Types of Business Analytics
Business analytics can be divided into several types, each addressing different kinds of decision-making needs and business processes (Thomas H. Davenport, 2013).
TipTypes of Business Analytics
| Type | Description | Key Features | Examples |
|---|---|---|---|
| Descriptive | Focuses on describing or summarizing past data to understand what has happened in the business. | Uses data aggregation and data mining techniques. Provides insights into past performance. |
Sales reports Customer churn rates |
| Diagnostic | Examines past performance to determine the causes of past success or failure. | Involves data discovery, correlations, and drill-downs. Answers “why did it happen?” |
Root cause analysis Performance discrepancies analysis |
| Predictive | Uses statistical models and forecasts techniques to understand the future. | Employs statistical algorithms and machine learning. Predicts future trends and outcomes. |
Market trends forecasting Demand prediction |
| Prescriptive | Suggests actions you can take to affect desired outcomes. | Combines insights from all other analytics. Recommends decisions using optimization and simulation algorithms. |
Supply chain optimization Dynamic pricing strategies |
| Cognitive | Mimics human brain function to improve decision-making. | Utilizes artificial intelligence and machine learning. Enhances human decision-making with insights from data analysis and pattern recognition. |
Chatbots for customer service Personalized marketing |
3.1 Descriptive Analytics
Descriptive analytics is the examination of historical data to understand changes that have occurred in a business.
By analyzing past events and performances, descriptive analytics helps organizations understand the reasons behind success or failure, identify trends, and make informed decisions. It is often considered the first step in the broader field of business analytics, laying the groundwork for more advanced predictive and prescriptive analysis.
3.1.1 How Descriptive Analytics Works
Descriptive analytics provides insight into what has happened by analyzing historical data. It is foundational to business intelligence and supports informed decision-making. The process typically involves the following key steps:
Data Aggregation and Integration: Data from multiple internal and external sources—such as CRM systems, databases, and web logs—is combined to form a unified dataset for analysis.
Data Cleaning and Transformation: The collected data is preprocessed to ensure quality. This includes handling missing values, correcting inconsistencies, and converting formats to make the data analysis-ready.
Data Summarization: Basic statistical techniques like averages, medians, and frequency counts are used to condense complex datasets into understandable summaries.
Trend and Pattern Identification: Analysts examine time-series and categorical data to detect recurring patterns, seasonal effects, or unexpected shifts in performance.
Reporting and Visualization: Insights are communicated using charts, dashboards, and summary tables—commonly built using tools like Power BI, Tableau, Excel, or R Shiny—to enable fast and effective interpretation by decision-makers.
3.1.2 Techniques Used in Descriptive Analytics
Data Aggregation
Combines data from multiple sources or categories to provide a consolidated view. This is often the first step in creating reports and dashboards.Data Cleaning and Preparation
Involves handling missing values, removing duplicates, correcting inconsistencies, and standardizing formats to ensure data quality before analysis.Frequency Analysis
Measures how often values or events occur in a dataset. It helps in identifying common behaviors, outliers, and categorical distributions.Measures of Central Tendency and Dispersion
Techniques such as mean, median, mode, range, variance, and standard deviation are used to describe the distribution and variability of data.Cross-Tabulation
A method to analyze the relationship between two or more categorical variables by displaying them in a matrix format (contingency tables).Time Series Analysis
Analyzes data points collected or recorded at specific time intervals to detect trends, seasonal effects, and cyclic patterns.Data Visualization
Graphical representations such as bar charts, histograms, line plots, pie charts, and heatmaps are used to communicate insights clearly and effectively.Dashboards and Reporting
Interactive dashboards and summary reports created using tools like Power BI, Tableau, Excel, or R Shiny present descriptive insights in a user-friendly format.
3.1.3 Applications of Descriptive Analytics
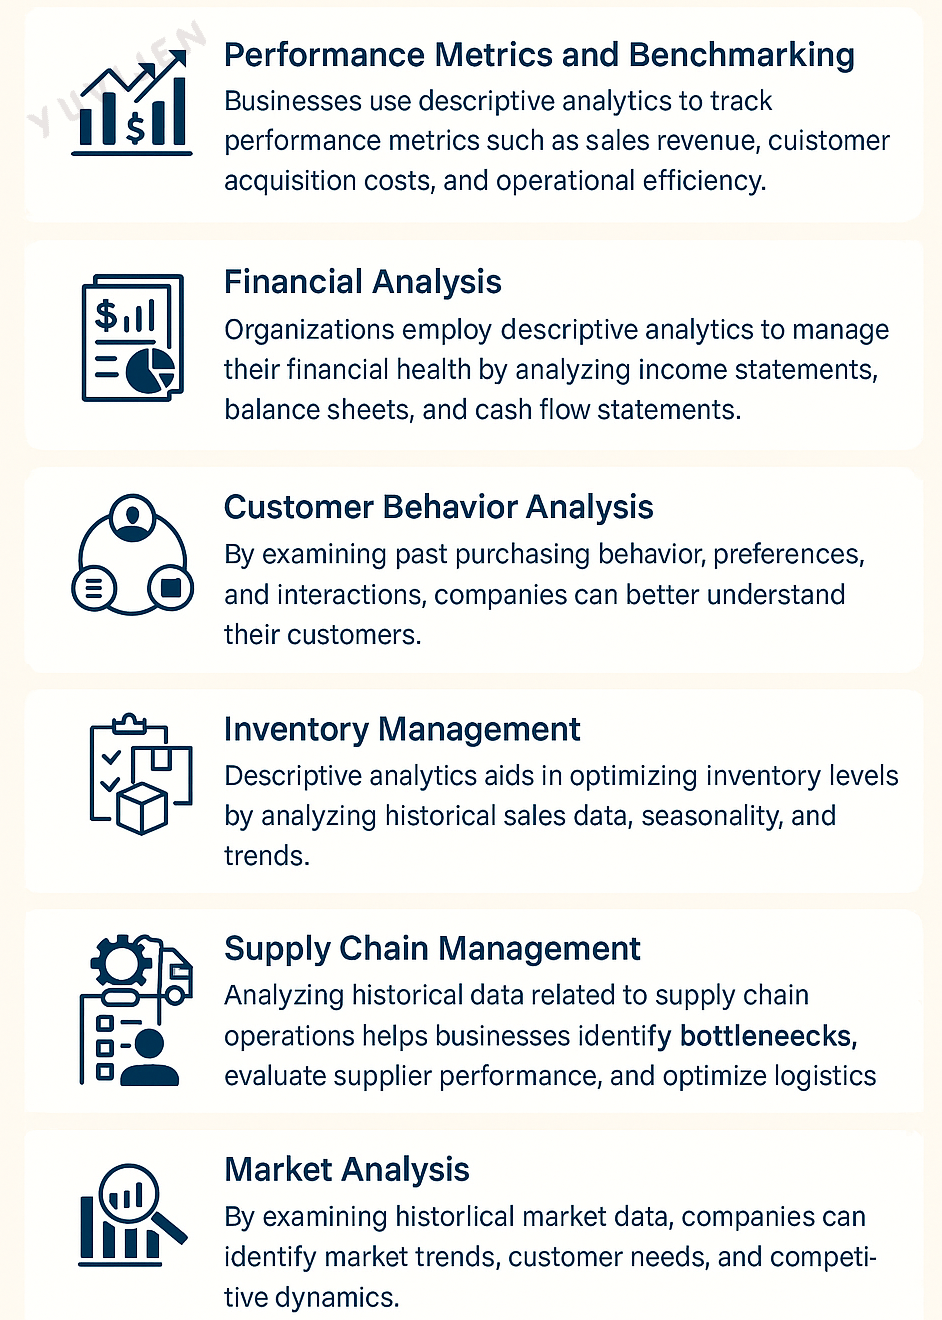
Performance Metrics and Benchmarking: Businesses use descriptive analytics to track performance metrics such as sales revenue, customer acquisition costs, and operational efficiency. By comparing these metrics against industry benchmarks, companies can gauge their performance and identify areas for improvement.
Financial Analysis: Organizations employ descriptive analytics to manage their financial health by analyzing income statements, balance sheets, and cash flow statements. This analysis helps in understanding revenue streams, expenses, profitability, and liquidity positions.
Customer Behavior Analysis: By examining past purchasing behaviors, preferences, and interactions, companies can better understand their customers. This insight is critical for improving customer service, tailoring marketing strategies, and enhancing customer retention.
Inventory Management: Descriptive analytics aids in optimizing inventory levels by analyzing historical sales data, seasonality, and trends. This enables businesses to reduce carrying costs, minimize stockouts, and improve order fulfillment.
Supply Chain Management: Analyzing historical data related to supply chain operations helps businesses identify bottlenecks, evaluate supplier performance, and optimize logistics. This leads to more efficient supply chain operations and cost reductions.
Human Resources: HR departments use descriptive analytics to analyze employee data, including performance evaluations, retention rates, and hiring channels. This analysis supports workforce planning, employee development, and retention strategies.
Market Analysis: By examining historical market data, companies can identify market trends, customer needs, and competitive dynamics. This information is crucial for strategic planning, market positioning, and product development.
3.2 Diagnostic Analytics
Diagnostic analytics takes a step further from descriptive analytics by not just describing what has happened in the past, but also attempting to understand why it happened.
It involves drilling down into your data, discovering patterns, identifying anomalies, and investigating the causes behind observed events or behaviors. Diagnostic analytics is essentially about finding relationships among data points and determining the factors that contribute to a particular outcome.
3.2.1 How Diagnostic Analytics Works
Data Collection and Preparation
Diagnostic analysis begins with collecting relevant data from multiple sources, such as transactional systems, logs, customer feedback, or IoT devices. The data is then cleaned, transformed, and integrated to ensure accuracy, consistency, and usability for in-depth analysis.Anomaly Detection
Analysts apply statistical and algorithmic techniques to identify data points or patterns that deviate from expected behavior. These anomalies often signal performance issues, errors, or emerging trends that warrant further investigation.Drill-Down and Data Segmentation
Once anomalies are detected, analysts perform drill-down analysis—breaking the data into subcategories (e.g., by region, product line, or time period) to uncover patterns or pinpoint specific contributors to the anomaly.Hypothesis Development and Testing
Based on the insights gathered, analysts formulate hypotheses to explain the underlying causes. These hypotheses are validated using statistical tests such as t-tests, chi-square tests, or regression analysis, depending on the data structure.Root Cause Analysis (RCA)
The final step involves applying structured RCA techniques—such as the 5 Whys, Fishbone (Ishikawa) diagrams, or Pareto analysis—to isolate and confirm the fundamental drivers behind the observed issues or trends. This enables organizations to implement targeted corrective actions.
3.2.2 Techniques Used in Diagnostic Analytics
Drill-Down Analysis
Breaks down high-level data into more detailed views (e.g., by region, time, or product category) to isolate specific drivers behind changes or anomalies. Common in business intelligence dashboards.Anomaly Detection
Uses statistical and machine learning methods to automatically detect values or behaviors that deviate from normal patterns. These anomalies often point to fraud, errors, or operational issues.Statistical & Correlation Analysis
Examines relationships between variables to identify whether they move together and in what direction. While useful for detecting associations, it does not imply causation.Regression Analysis
Measures how independent variables influence a target variable. Techniques include linear, logistic, and multivariate regression. Regression is key to estimating the strength of relationships and testing causal assumptions.Hypothesis Testing
Involves formulating and statistically testing assumptions about relationships or causes behind data trends. Methods like t-tests, ANOVA, and chi-square tests help validate insights.Multivariate & Multimodal Testing
Evaluates how multiple variables interact simultaneously to affect outcomes. Advanced approaches now combine different data types, such as numerical, textual, or sensor data, for deeper insights.Data Mining & Pattern Discovery
Applies algorithms such as clustering, decision trees, and association rules to explore large datasets for hidden patterns and relationships that may not be visible through basic analysis.
3.2.3 Applications of Diagnostic Analytics
Diagnostic analytics plays a crucial role across industries by helping organizations understand the root causes of performance issues, anomalies, and behavioral patterns. It bridges the gap between descriptive insight and actionable decision-making. Key applications include:
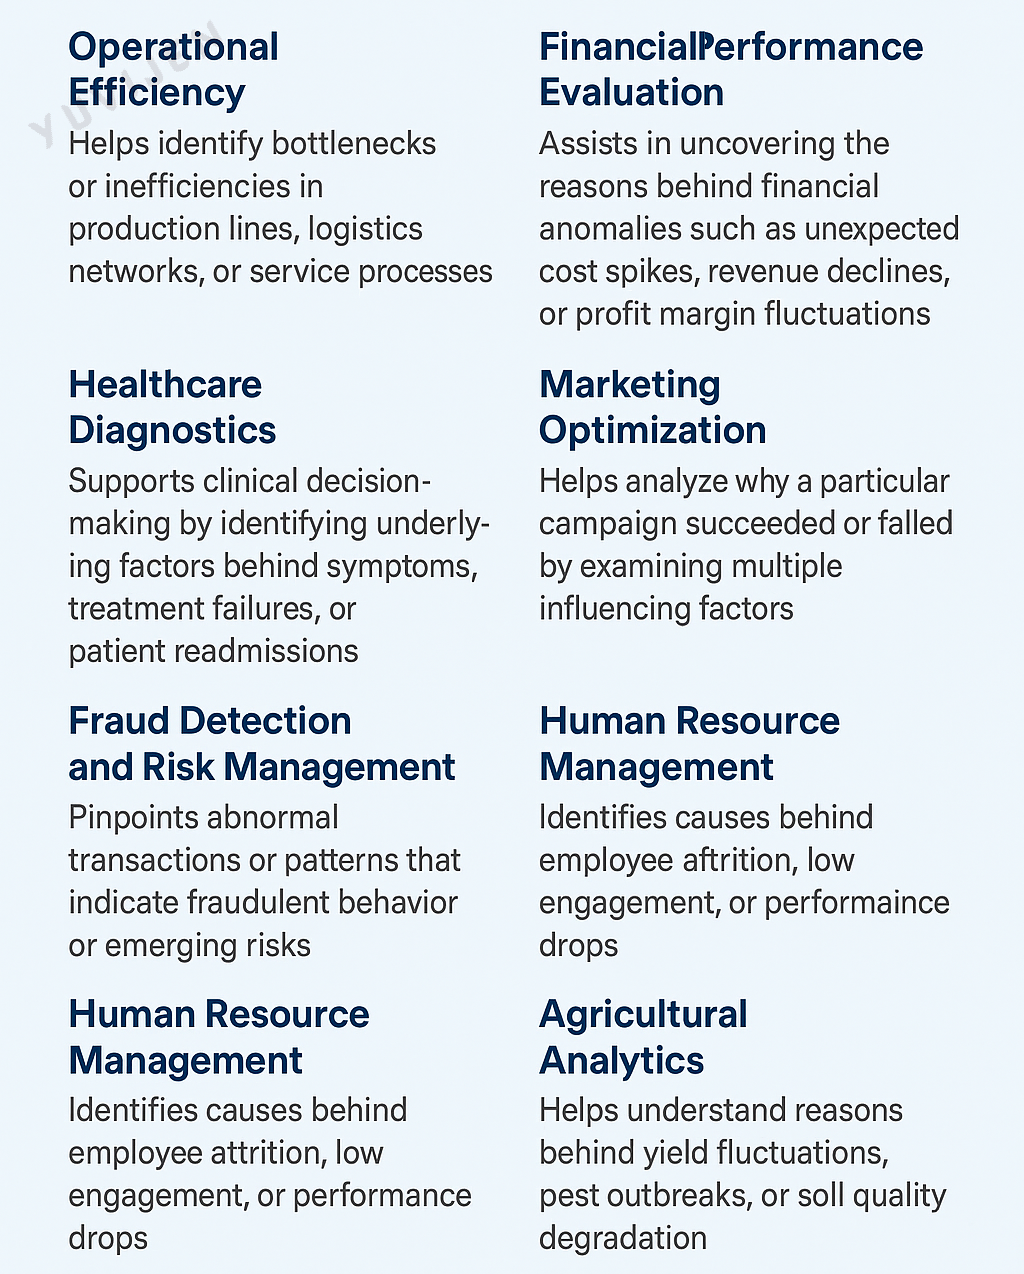
Operational Efficiency
Helps identify bottlenecks or inefficiencies in production lines, logistics networks, or service processes. By drilling down into performance data, businesses can isolate and address process-level problems.Customer Behavior Analysis
Enables deeper understanding of why customer churn, satisfaction drops, or purchase behavior changes occur. This insight supports retention strategies, personalization, and product/service improvements.Financial Performance Evaluation
Assists in uncovering the reasons behind financial anomalies such as unexpected cost spikes, revenue declines, or profit margin fluctuations. This supports more informed budgeting and forecasting.Fraud Detection and Risk Management
Pinpoints abnormal transactions or patterns that indicate fraudulent behavior or emerging risks. Financial institutions and cybersecurity teams use diagnostic methods to trace root causes and mitigate threats early.Healthcare Diagnostics
Supports clinical decision-making by identifying underlying factors behind symptoms, treatment failures, or patient readmissions. Diagnostic analytics aids in improving quality of care and operational workflows.Marketing Optimization
Helps analyze why a particular campaign succeeded or failed by examining multiple influencing factors such as channel performance, audience segments, or timing.IT and System Monitoring
In IT operations, diagnostic analytics helps trace system failures, performance slowdowns, or security breaches by analyzing system logs and performance metrics.Human Resource Management
Identifies causes behind employee attrition, low engagement, or performance drops. Diagnostic analytics enables data-driven decisions in recruitment, training effectiveness, and workforce planning.Agricultural Analytics
Helps understand reasons behind yield fluctuations, pest outbreaks, or soil quality degradation. By analyzing climate, soil, and input data, farmers and agribusinesses can make informed interventions to improve productivity.
3.3 Predictive Analytics
Predictive analytics encompasses a suite of statistical techniques and models that analyze historical and current data to make predictions about future events or behaviors.
This branch of analytics is fundamentally about forecasting and is instrumental in various sectors for identifying trends, understanding customer behavior, managing risks, and optimizing operational processes. It leverages techniques from data mining, statistics, modeling, machine learning, and artificial intelligence to analyze and interpret data, thereby forecasting future probabilities with an acceptable level of reliability.
3.3.1 How Predictive Analytics Works
Predictive analytics uses statistical models and machine learning algorithms to forecast future outcomes based on historical and current data. It helps organizations move from understanding past behavior to anticipating future events. The process typically follows these key steps:
Problem Definition and Goal Setting
Clearly defining the business problem or decision that needs forecasting—such as predicting customer churn, sales demand, or equipment failure—is the foundation for building a meaningful predictive model.Data Collection and Integration
Relevant data from internal and external sources is gathered and integrated. This may include transactional records, customer behavior, sensor data, or third-party datasets.Data Preparation and Feature Engineering
The raw data is cleaned and transformed. Important features (predictor variables) are created or selected to improve model accuracy. This step may involve encoding categorical variables, scaling, handling missing values, and reducing dimensionality.Model Selection and Training
Suitable algorithms—such as linear regression, decision trees, random forests, support vector machines, or neural networks—are selected based on the problem type. The model is trained on historical data using supervised learning techniques.Model Evaluation and Validation
Performance is assessed using metrics like accuracy, precision, recall, F1-score, RMSE (Root Mean Square Error), or AUC-ROC, depending on the prediction type (classification or regression). Cross-validation ensures that the model generalizes well to unseen data.Deployment and Monitoring
Once validated, the model is deployed into a production environment where it can make real-time or batch predictions. Ongoing monitoring and periodic retraining are essential to maintain accuracy as data and conditions evolve.Interpretation and Decision Support
Results are visualized and communicated through dashboards or decision support systems, allowing stakeholders to make data-driven decisions based on forecasted insights.
3.3.2 Techniques Used in Predictive Analytics
Predictive analytics uses a variety of statistical and machine learning techniques to anticipate future events and behaviors. These methods enable organizations to forecast outcomes, reduce risk, and optimize decision-making. Commonly used techniques include:
Linear and Logistic Regression
Regression models are foundational to predictive analytics. Linear regression predicts continuous outcomes, while logistic regression is used for binary classification problems, such as predicting whether a customer will churn or not.Decision Trees and Random Forests
Decision trees segment the dataset based on conditions to make predictions. Random forests, an ensemble method, combine multiple decision trees to improve accuracy and reduce overfitting.Time Series Forecasting
Techniques such as ARIMA, Exponential Smoothing, and Prophet are used to model and predict values over time. These are particularly useful for sales forecasting, stock prices, or demand planning.Support Vector Machines (SVM)
A supervised learning model used for both classification and regression tasks. SVMs find the optimal boundary between classes to make accurate predictions.Neural Networks and Deep Learning
These models are effective for capturing complex, non-linear relationships in large datasets. Deep learning is especially useful for image recognition, speech prediction, and natural language tasks.K-Nearest Neighbors (KNN)
A simple yet effective technique that predicts the output based on the ‘k’ most similar data points in the training set.Gradient Boosting Machines (GBM) and XGBoost
Advanced ensemble techniques that build strong predictive models by combining many weak learners, often outperforming traditional models in structured data tasks.Classification and Clustering Algorithms
While classification (e.g., Naïve Bayes) is used for labeled data prediction, clustering (e.g., K-means) helps identify hidden groupings and can be used to build predictive features.
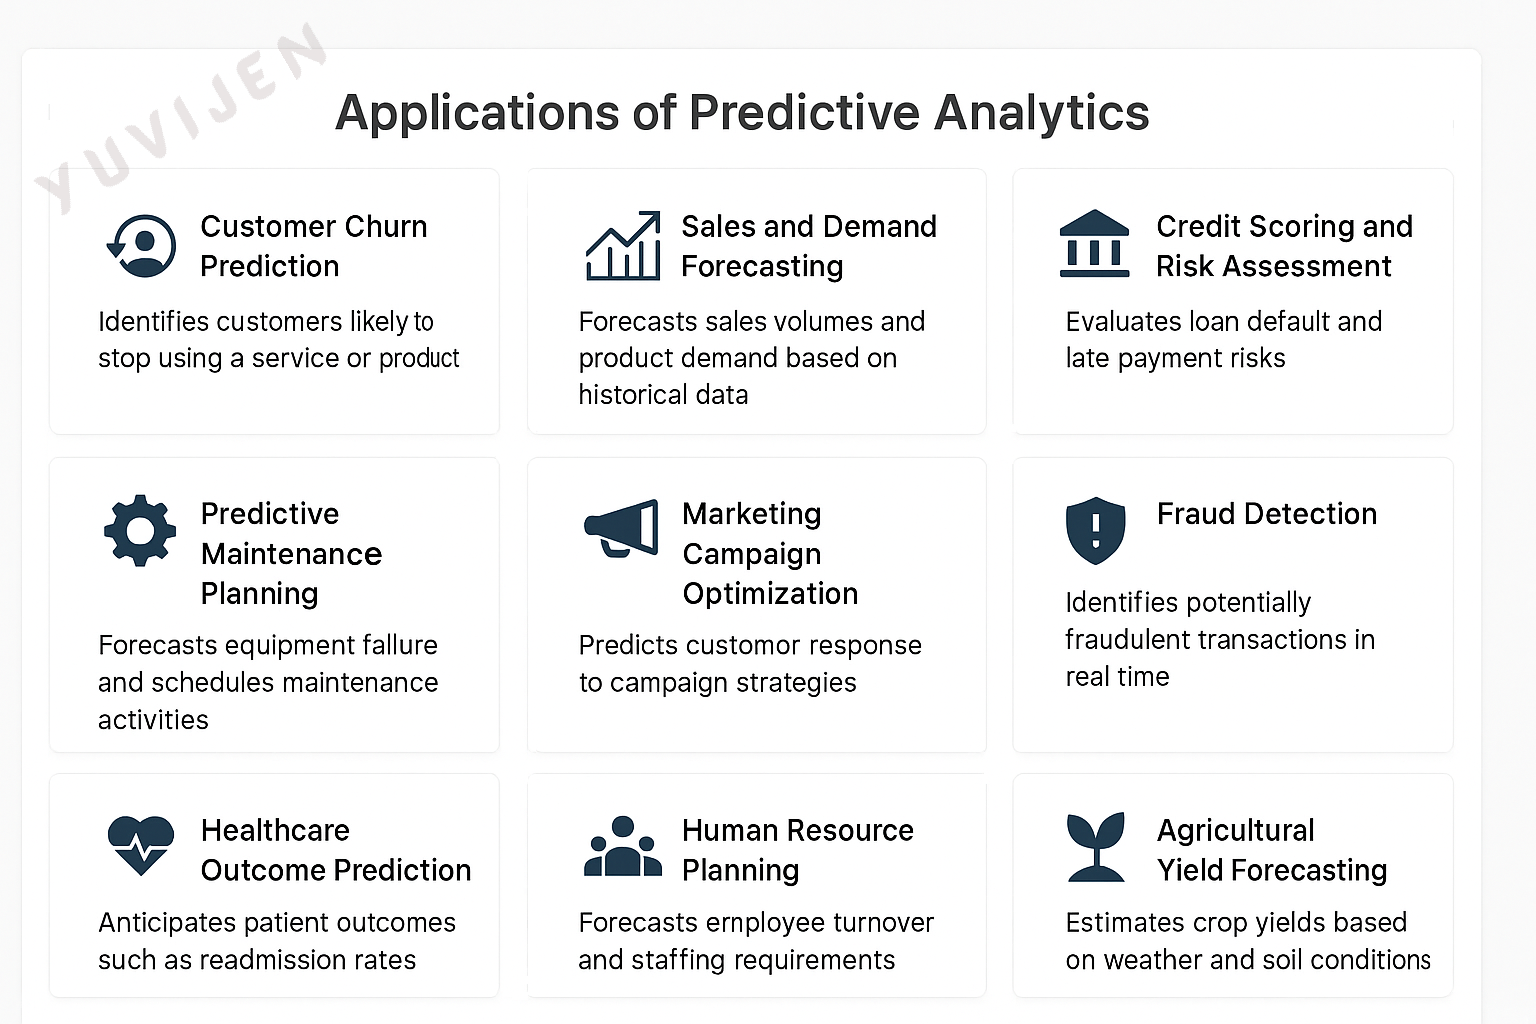
3.3.3 Applications of Predictive Analytics
3.4 Prescriptive Analytics
Prescriptive analytics represents the cutting edge of business analytics, offering not just insights or forecasts but actionable recommendations designed to guide decision-making toward optimal outcomes.
It synthesizes information from descriptive and predictive analytics to suggest specific actions and consider the implications of each decision option. By employing advanced techniques like optimization, simulation, and machine learning, prescriptive analytics helps businesses not only to anticipate future trends but also to shape them.
3.4.1 How Prescriptive Analytics Works
Prescriptive analytics is the most advanced stage of data analytics. It not only forecasts potential future outcomes (as predictive analytics does) but also recommends specific actions to achieve desired objectives or avoid undesired results. It integrates data, models, business rules, and optimization algorithms to guide decision-making. The process typically involves the following steps:
Define Objectives and Constraints
Clearly articulating the business goal (e.g., maximizing revenue, minimizing risk) and identifying relevant constraints such as budget limits, resource availability, or policy rules.Data Collection and Preparation
Gathering relevant historical and real-time data from internal systems, sensors, or external sources. The data is then cleaned, transformed, and formatted for analysis.Predictive Modeling
Building predictive models to estimate future outcomes based on current and historical data. These models provide input for prescriptive decision-making.Optimization and Simulation
Using optimization algorithms (e.g., linear programming, genetic algorithms) and simulation techniques to evaluate different scenarios and identify the most effective course of action under given constraints.Recommendation Generation
The system provides actionable recommendations—what actions to take, when to take them, and what the likely outcomes will be. These can be presented through dashboards, reports, or automated decision engines.Execution and Automation
In advanced settings, prescriptive models are integrated into operational systems, enabling automated execution of recommended actions (e.g., dynamic pricing, route changes, or resource reallocation).Monitoring and Feedback
Continuous monitoring of the outcomes from implemented decisions ensures that the system learns and improves over time. Feedback loops help refine models and maintain their effectiveness in changing environments.
3.4.2 Techniques Used in Prescriptive Analytics
Prescriptive analytics employs a combination of mathematical, statistical, and computational techniques to recommend optimal actions. These methods go beyond insight and prediction by integrating decision logic, resource constraints, and goal-oriented outcomes. Common techniques include:
Optimization Algorithms
Mathematical models such as linear programming, integer programming, and nonlinear optimization are used to find the best solution from a set of feasible options. These are widely applied in logistics, finance, and resource allocation.Simulation Modeling
Techniques like Monte Carlo simulation and discrete-event simulation are used to model complex systems under uncertainty. They help evaluate how different decisions may play out in real-world scenarios without taking actual risks.Decision Analysis
Includes decision trees, influence diagrams, and utility theory to evaluate choices under uncertainty. These tools help quantify trade-offs and identify the most rational course of action.Heuristic and Metaheuristic Methods
Approaches such as genetic algorithms, simulated annealing, and particle swarm optimization are used when exact solutions are computationally expensive. These methods find near-optimal solutions for complex problems like scheduling and routing.Constraint Programming
A powerful method used for solving problems that involve a large number of interdependent constraints, such as timetabling, supply chain configuration, or network design.Machine Learning for Recommendation Systems
Algorithms like collaborative filtering, reinforcement learning, or contextual bandits are used to provide personalized and adaptive recommendations in areas like e-commerce, content delivery, and pricing.What-If and Scenario Analysis
Involves testing multiple hypothetical situations to understand how changes in inputs affect outcomes. This helps in evaluating risks, preparing contingency plans, and choosing robust strategies.
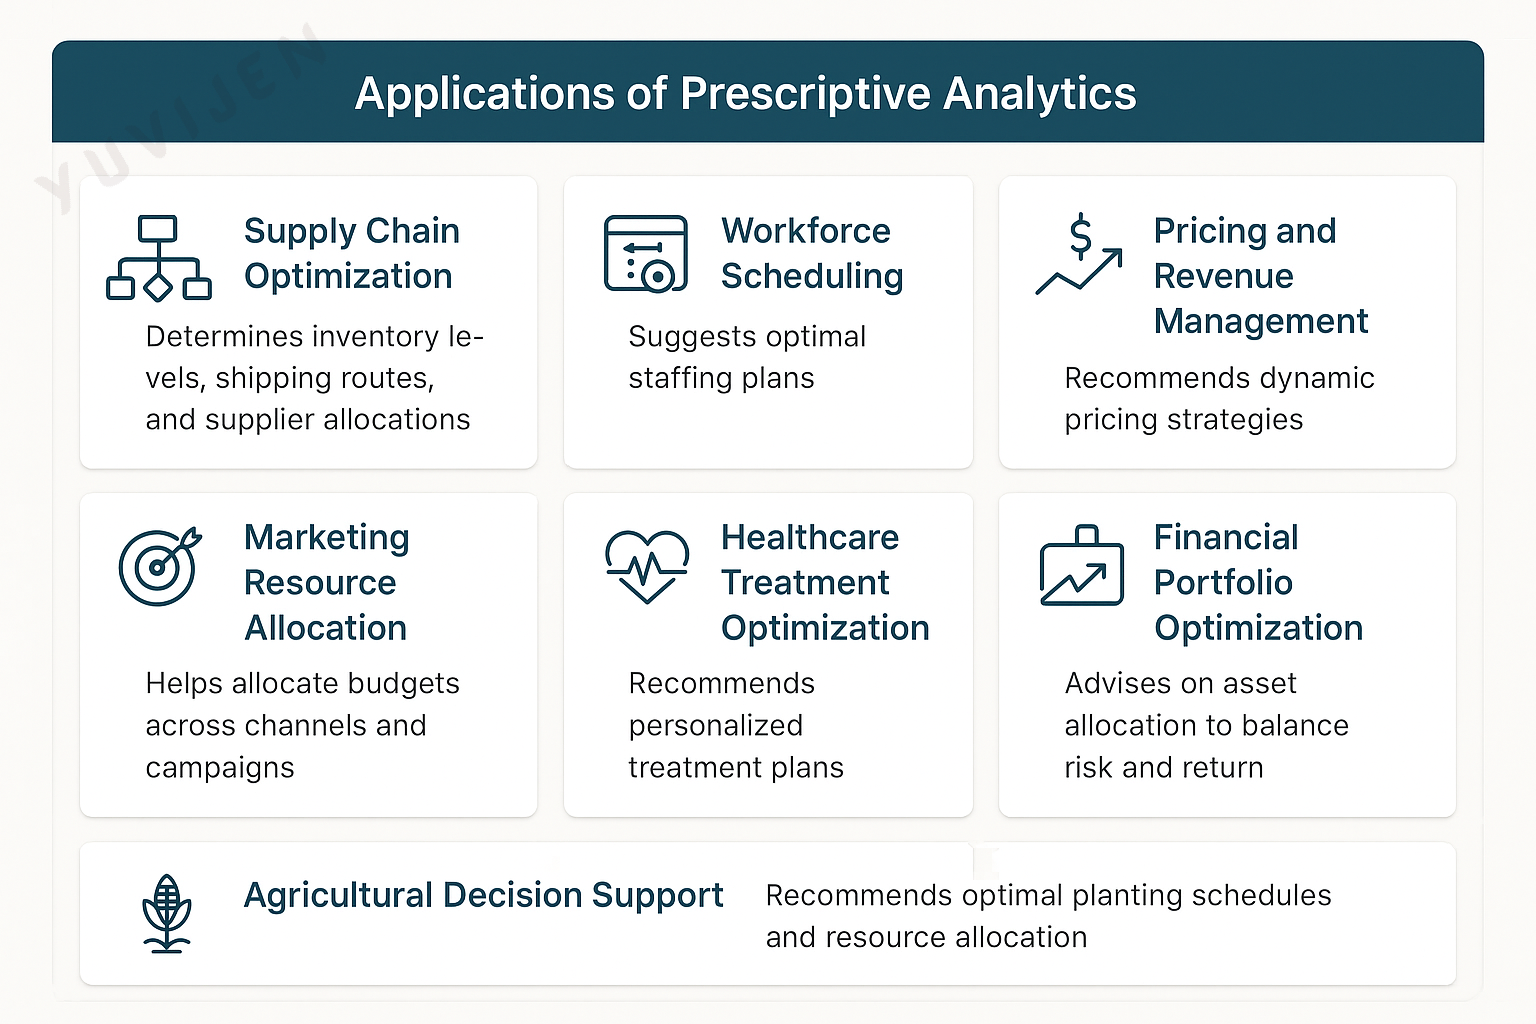
3.4.3 Applications of Prescriptive Analytics
3.5 Cognitive Analytics
Cognitive analytics is an advanced area of analytics that seeks to mimic human reasoning and thought processes in a computerized model. It leverages technologies such as artificial intelligence (AI), machine learning, natural language processing (NLP), and data mining to analyze large volumes of data in a way that mimics human understanding and insight. This approach allows businesses to process and interpret unstructured data, such as text, images, and voice, in a sophisticated manner that traditional analytics methods cannot achieve. Cognitive analytics systems learn and evolve based on the information they process, continually improving and providing deeper insights over time.
3.5.1 Key Features of Cognitive Analytics
- Learning Capability: Unlike traditional analytics tools that follow predefined rules and algorithms, cognitive analytics systems learn from data patterns and human interactions, allowing them to adapt and make predictions or recommendations.
- Natural Language Processing (NLP): These systems can understand and interpret human language, enabling them to analyze text data from various sources like emails, social media, and webpages.
- Machine Learning: Through machine learning, cognitive analytics systems can improve their accuracy and efficiency as they process more data, identifying patterns and insights that were previously unnoticed.
- Data Mining: Cognitive analytics applies advanced data mining techniques to uncover relationships, patterns, and trends from vast and complex datasets.
3.5.2 How Cognitive Analytics Works
Cognitive analytics is an advanced form of data analytics that combines artificial intelligence (AI), machine learning (ML), natural language processing (NLP), and human-like reasoning to simulate how the human brain interprets and interacts with information. It aims to provide context-aware, adaptive, and intelligent decision support. The process typically involves the following stages:
Data Ingestion from Diverse Sources
Cognitive systems process both structured (e.g., databases, spreadsheets) and unstructured data (e.g., emails, social media, sensor feeds, documents). This includes text, images, video, audio, and more.Natural Language Processing (NLP)
NLP enables systems to understand, interpret, and generate human language. It helps in extracting meaning, intent, sentiment, and context from large volumes of textual data.Machine Learning and Pattern Recognition
Machine learning algorithms are used to recognize complex patterns, learn from data, and adapt over time. These systems improve their recommendations or decisions as they are exposed to new information.Knowledge Representation and Reasoning
Cognitive analytics systems build knowledge graphs, semantic networks, or ontologies to represent domain knowledge. They apply reasoning engines to make inferences, draw conclusions, or identify gaps in understanding.Contextual Awareness and Decision Support
Unlike traditional analytics, cognitive systems factor in context—such as user behavior, environmental conditions, or historical trends—before offering recommendations or answers.Human-Machine Interaction and Learning
Cognitive systems are designed to learn from interactions with users, refining their outputs based on feedback. This creates a dynamic, collaborative relationship between humans and machines.Continuous Learning and Adaptation
Cognitive systems don’t rely solely on static models. They continuously update their models based on new inputs, feedback, and outcomes, making them more intelligent and adaptive over time.
3.5.3 Techniques Used in Cognitive Analytics
Cognitive analytics integrates artificial intelligence (AI) technologies with data analytics to simulate human thinking and reasoning. It enables systems to understand, interpret, and learn from complex data, both structured and unstructured. The following techniques form the foundation of cognitive analytics:
Natural Language Processing (NLP)
Allows systems to understand and generate human language. NLP techniques such as tokenization, named entity recognition, sentiment analysis, and text summarization are used to extract meaning from unstructured text data.Machine Learning (ML)
Enables systems to learn patterns from data and improve predictions over time. Both supervised and unsupervised learning algorithms, including decision trees, neural networks, clustering, and support vector machines, are widely used.Deep Learning
A subfield of machine learning that uses multi-layered neural networks to model complex patterns in large datasets. It is particularly effective for image recognition, voice processing, and natural language understanding.Knowledge Representation and Ontologies
Cognitive systems use semantic models like knowledge graphs, taxonomies, and ontologies to represent domain-specific knowledge. These structures help machines reason, infer relationships, and navigate complex data environments.Context-Aware Computing
Cognitive analytics systems factor in contextual data—such as time, location, user preferences, and behavior patterns—to enhance relevance and personalization of insights and recommendations.Computer Vision
Uses AI techniques to interpret and analyze visual information from images and videos. This supports applications like facial recognition, object detection, and scene understanding.Cognitive Agents and Chatbots
Virtual assistants powered by NLP and ML engage in human-like interactions, understanding user intent and responding intelligently. These agents are increasingly used in customer support, healthcare, and education.Reinforcement Learning
A type of machine learning where systems learn optimal actions through trial and error, based on feedback from the environment. Useful for dynamic decision-making in real-time scenarios.
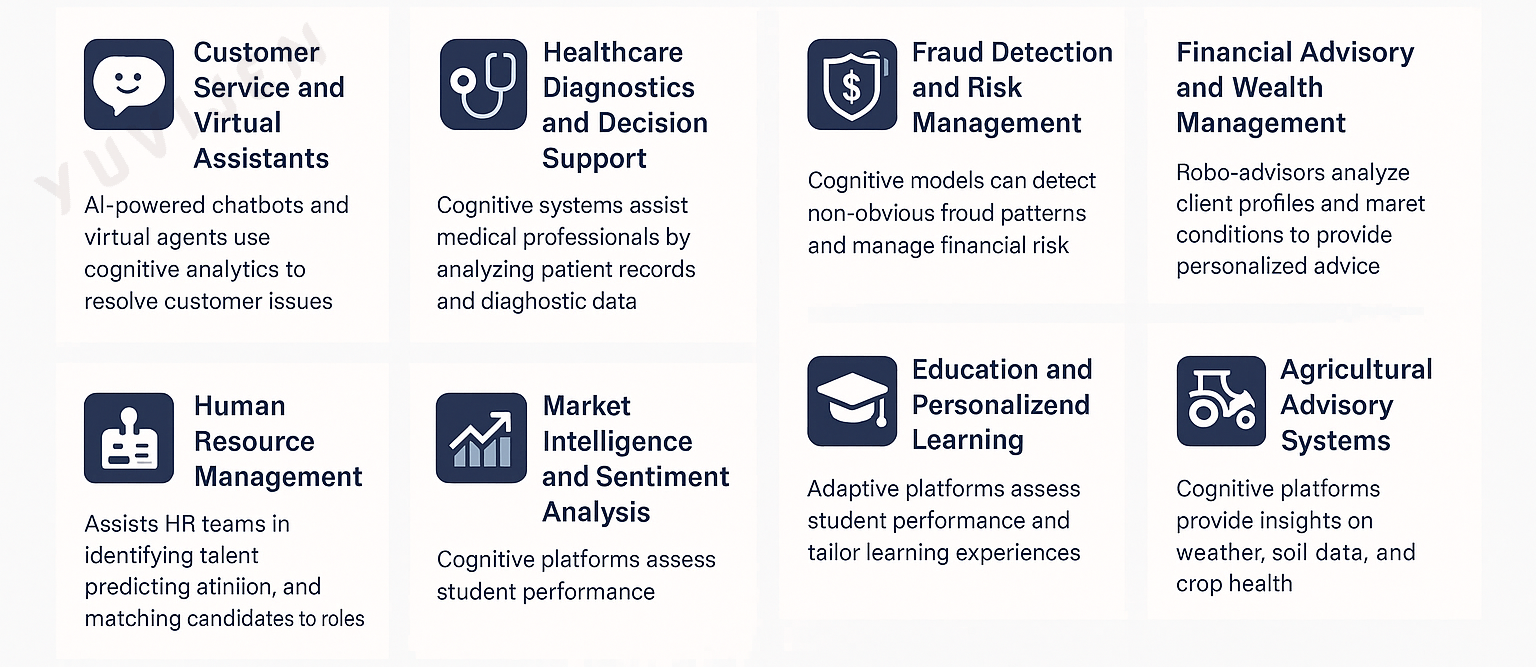
3.5.4 Applications of Cognitive Analytics
3.6 Comparison of Analytics Types
| Aspect | Descriptive Analytics | Diagnostic Analytics | Predictive Analytics | Prescriptive Analytics |
|---|---|---|---|---|
| Primary Question | What happened? | Why did it happen? | What is likely to happen? | What should be done? |
| Objective | Summarize and interpret historical data | Identify root causes and contributing factors | Forecast future trends or outcomes | Recommend optimal actions and strategies |
| Data Used | Historical data | Historical data with deeper segmentation | Historical + current data | Predictive outputs + constraints and business rules |
| Techniques | Aggregation, statistics, visualization | Drill-down, correlation, hypothesis testing | Regression, classification, time series, ML | Optimization, simulation, decision trees, reinforcement learning |
| Tools Commonly Used | Excel, Power BI, Tableau | SQL, R, Python, Excel Pivot Tables | Python (scikit-learn), R, SAS, forecasting tools | CPLEX, Gurobi, IBM Decision Optimization, Python (PuLP) |
| Complexity Level | Low | Moderate | High | Very High |
| Example | Monthly sales dashboard | Analyzing why sales dropped in Region X | Forecasting next quarter’s sales | Recommending best pricing or inventory levels |
| Human Involvement | High (manual interpretation) | High (interpretation and hypothesis formulation) | Medium (model training and validation) | Low to Medium (automated decision support systems) |