| Concept | Description |
|---|---|
| Foundations | |
| t-test | Hypothesis test for comparing sample means to a reference or to another sample |
| Student's t-Distribution | Distribution with heavier tails than the normal, used when the population variance is estimated from the sample |
| Small Sample, Unknown Variance | The t-test shines when n is small and sigma is unknown, unlike the Z-test |
| Types of t-test | |
| One-Sample t-test | Compares the mean of a single sample to a known reference value |
| Independent Samples t-test | Compares the means of two independent groups to see if they differ |
| Paired Samples t-test | Compares means from the same units measured at two times or under two conditions |
| Welch's t-test | Variant of the independent t-test that does not assume equal variances |
| Assumptions | |
| Independence | Each observation must be independent of every other observation |
| Normality | The sampled data should be approximately normally distributed |
| Equality of Variances | Independent-samples t-test assumes equal variances unless Welch's correction is used |
| Degrees of Freedom | |
| Degrees of Freedom | The number of values free to vary, which determines the exact t-distribution used |
| df for One-Sample | Equals n minus 1 for one-sample t-tests |
| df for Independent | Equals n1 plus n2 minus 2 for independent-samples t-tests |
| df for Paired | Equals n minus 1 for paired t-tests, where n is the number of pairs |
| Interpretation | |
| p-value Interpretation | A p-value below the chosen alpha indicates the observed difference is unlikely under the null hypothesis |
| Applications | |
| Education | Compare test scores, teaching methods, and learning outcomes |
| Medicine | Assess the effect of treatments, drugs, or interventions |
| Manufacturing | Compare process performance before and after a change |
| Social Sciences | Compare social, psychological, and behavioural outcomes across groups |
23 T-tests
The t-test (Student, 1908) is a foundational statistical hypothesis test used to determine if there is a significant difference between the means of two groups, which may be related in certain features.
It is applied when the test statistic follows a normal distribution and the value of a scaling term in the test statistic follows a Student’s t-distribution under the null hypothesis.
The t-test is most commonly applied when the test statistic would follow a normal distribution if the value of a scaling term in the test statistic were known. When the scaling term is unknown and is replaced by an estimate based on the data, the test statistics (under certain conditions) follow a Student’s t distribution.
23.1 When to use T test
Small Samples: The T-test extends the principles learned from the Z-test to situations where the sample size is small (usually n < 30) and the population variance is unknown. It introduces the concept of using sample data to estimate population parameters, adding a layer of complexity.
Student’s T-Distribution: The T-test introduces a new distribution, the T-distribution, which is more spread out than the Z-distribution, especially for small sample sizes. The shape of the T-distribution changes with the degrees of freedom, a concept not encountered with the Z-distribution.
23.2 Types of T-Tests
There are three main types of t-tests, each suited for different testing scenarios:
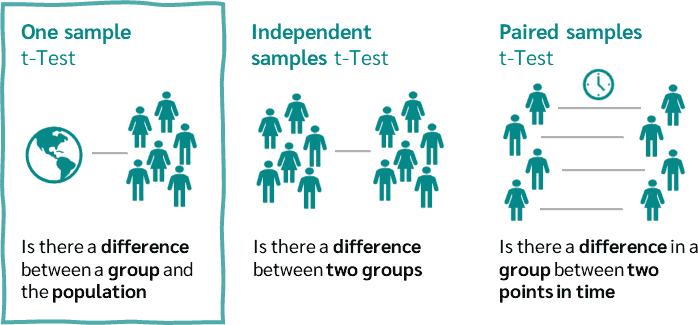
One-sample t-test: This test compares the mean of a single group against a known standard or mean. For instance, it could be used to determine if the average process time for completing a task is different from the standard time.
Independent Samples t-test: This test compares the means of two independent groups in order to determine whether there is statistical evidence that the associated population means are significantly different. It is used when the variances of two normal distributions are unknown and the samples are independent. A common example is comparing the test scores of two different groups of students.
Paired Samples t-test: This test is used to compare the means of the same group or related samples at two different points in time or under two different conditions. It’s often used in before-and-after studies, such as measuring the effect of a training program on the performance of athletes by measuring them before and after the program.
source: https://datatab.net/tutorial/one-sample-t-test
Applications
The t-test has widespread applications across various fields such as:
- Education: To compare test scores, teaching methods, or learning outcomes.
- Medicine: For assessing the effectiveness of treatments or drugs.
- Manufacturing and quality control: To determine if the process changes have led to improvements.
- Social sciences: To compare differences in social, psychological, or behavioral effects across groups.
Assumptions
For the t-test to be valid, certain assumptions must be met:
- Independence of Observations: Each observation must be independent of all other observations.
- Normality: The data should be approximately normally distributed, especially as the sample size increases (Central Limit Theorem).
- Equality of Variances (for independent samples t-test): The variances of the two groups being compared should be equal. When this assumption is violated, a variation of the t-test called Welch’s t-test can be used.
Interpretation
The output of a t-test is a p-value, which indicates the probability of observing the test results under the null hypothesis. If the p-value is below a predetermined threshold (commonly 0.05), the null hypothesis is rejected, indicating that there is a statistically significant difference between the groups being compared.
The t-test is a robust tool with wide applicability but must be used judiciously, respecting its assumptions for valid results. Advances in statistical methodologies have introduced more complex models for data analysis, yet the t-test remains a fundamental and widely used method for comparing means.
23.3 Concept of Degrees of Freedom in T-Tests
Degrees of freedom (df) in statistics generally refer to the number of values in a calculation that are free to vary without violating any constraints.
In the context of a t-test, degrees of freedom are crucial for determining the specific distribution of the t-statistic under the null hypothesis.
- A t-test is used to determine if there is a significant difference between the means of two groups under the assumption that the data follows a normal distribution but when the population standard deviation is not known.
- The t-test uses the sample standard deviation as an estimate of the population standard deviation. This estimation introduces more variability and uncertainty, which is why the t-distribution, rather than the normal distribution, is used.
- The t-distribution is wider and has thicker tails than the normal distribution, which accounts for this additional uncertainty.
23.4 Degrees of freedom in different types of t-tests:
One-Sample t-test:
df = n - 1, where \(n\) is the number of observations in the sample. Subtracting one accounts for the estimation of the sample mean from the sample data itself.Independent Two-Sample t-test:
df = \(n_1\) + \(n_2\) - 2, where \(n_1\) and \(n_2\) are the sample sizes of the two groups. Here, two degrees are lost because each group’s mean is estimated from its sample.Paired t-test:
df = n - 1. In paired samples, each pair’s difference is considered as a single piece of data. If there are \(n\) pairs, the degrees of freedom are n - 1, reflecting the \(n\) paired differences.
23.5 Why Z-Tests don’t have Degrees of Freedom 🤔 ?
The Z-test, unlike the t-test, does not involve degrees of freedom because it uses the population standard deviation (\(\sigma\)), which is assumed to be known.
Because the Z-test uses the actual population standard deviation and not an estimate from the sample, there is no extra uncertainty introduced by estimation that needs to be accounted for using degrees of freedom.
Consequently, the distribution of the Z-test statistic under the null hypothesis is the standard normal distribution (Z-distribution), which is not dependent on the sample size once the population standard deviation is known.