4 Overview of R and R Studio
What is R ?
- R (R Core Team, 2024), is a powerful language and environment for statistical computing and graphics.
- R is an open-source programming language, widely used among statisticians, data analysts, and researchers for data manipulation, calculation, and graphical display.
- R is not just a programming language, but also an environment for interactive statistical analysis.
- It was developed by Ross Ihaka and Robert Gentleman at the University of Auckland, New Zealand, and is currently maintained by the R Development Core Team.
- It is a GNU project and is freely available under the GNU General Public License.
- Packages: The R community is known for its active contributions in terms of packages. There are thousands of packages available in the Comprehensive R Archive Network (CRAN), covering various functions and applications.
- Platform Independent: R is available for various platforms such as Windows, MacOS, and Unix-like systems.
4.1 Installation and Setup
Install R
Download and install R from the Comprehensive R Archive Network CRAN and choose the relevant OS (Windows,mac,linux).
Install RStudio
RStudio is a recommended integrated development environment (IDE) for R. Download and install RStudio form POSIT and choose the relevant OS (Windows,mac,linux).
4.2 Overview of RStudio Panels
-
RStudio is a widely-used Integrated Development Environment (IDE) for R programming.
- RStudio’s design enhances the efficiency and user-friendliness of coding, testing, and data analysis in R.
- Its panels and features provide a comprehensive environment that caters to the needs of both novice and experienced R programmers.
- It features a user-friendly interface and is divided into several panels, each designed for specific tasks. Here’s a detailed overview of these panels.
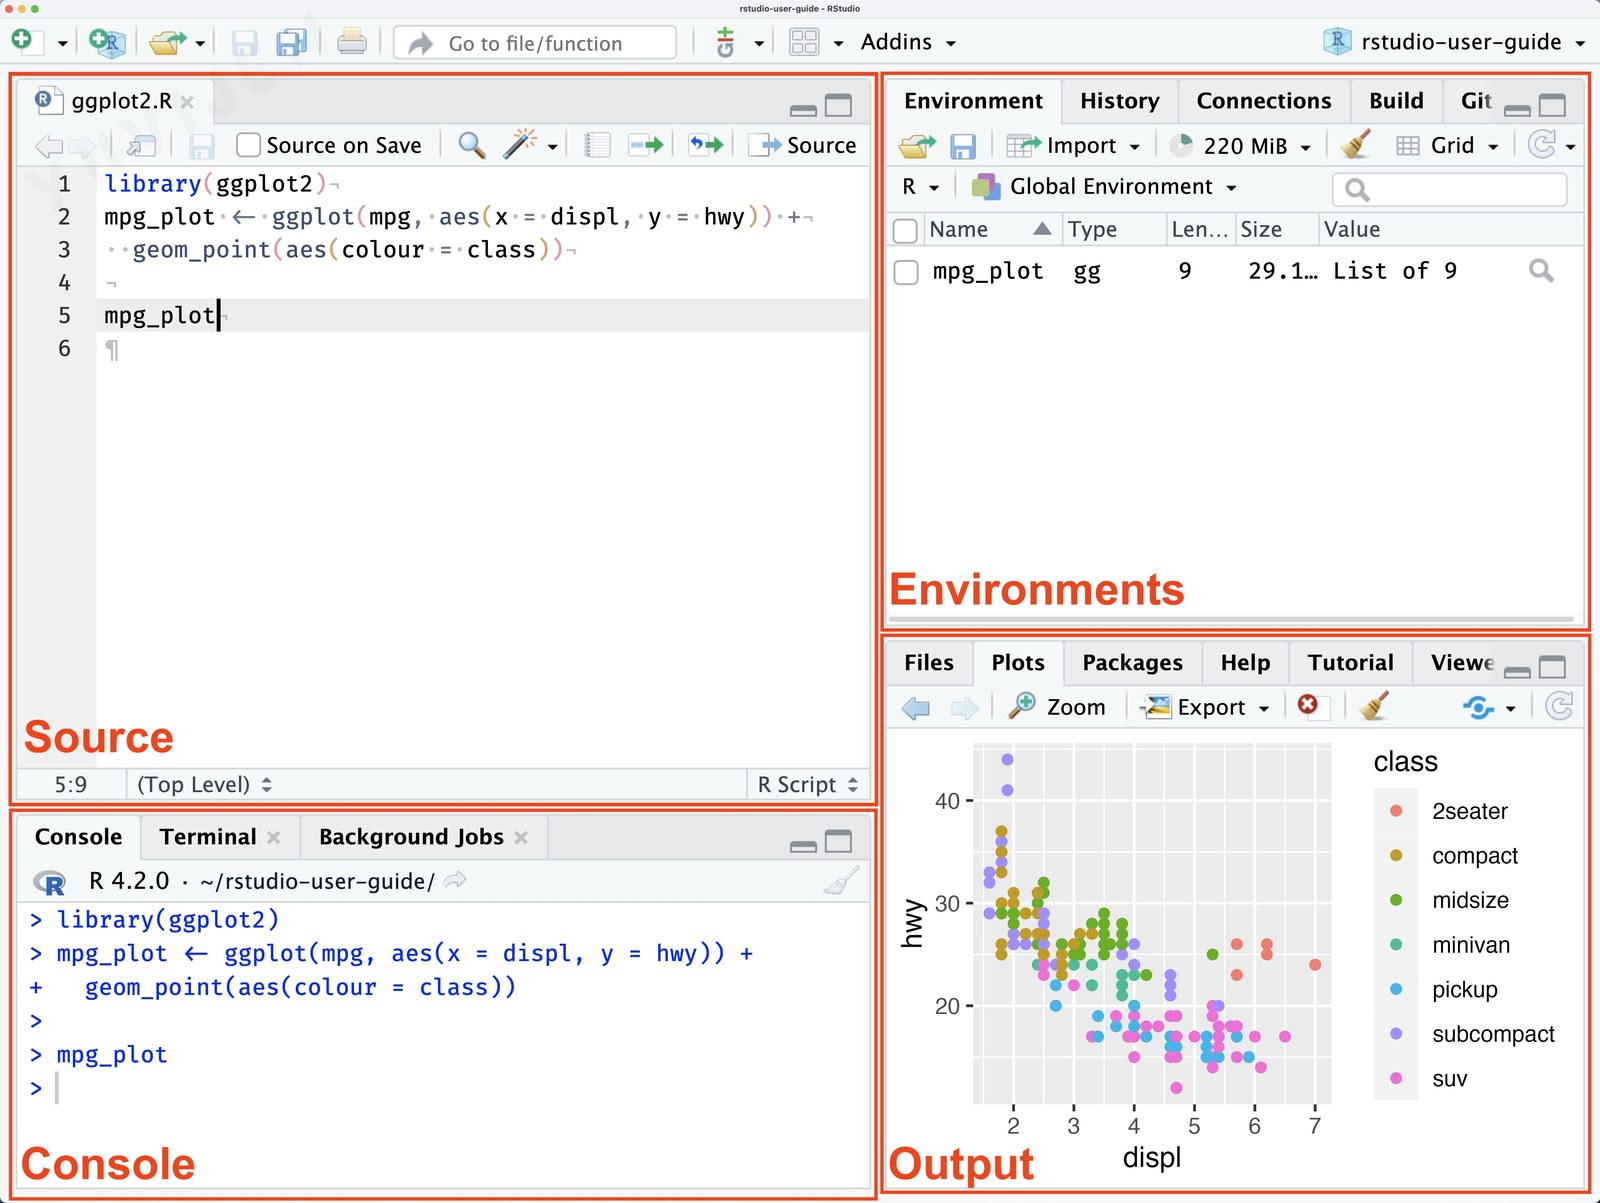
Source Panel (Top-Left by Default)
Source Panel
Function
This panel is where you write and edit your R scripts and R Markdown documents.
Features
- Syntax highlighting for R code.
- Code completion and hinting.
- Ability to run code directly from the script.
Console Panel (Bottom-Left by Default)
Console Panel
Function
This is where R code is executed interactively.
Features
- Direct execution of R commands.
- Displays results of script execution.
- Keeps a history of your commands.
Environment/History Panel (Top-Right by Default)
Environment/History Panel
Environment Tab
- Shows the current working dataset and variables in memory.
- Allows for inspection and management of data structures and variables.
History Tab
- Records all commands run in the Console.
- Enables re-running and insertion of previous commands into scripts.
Output/ Files/ Plots/ Packages/ Help/ Viewer Panel (Bottom-Right by Default)
Output/ Files/ Plots/ Packages/ Help/ Viewer Panel
Files Tab
- Manages project files and directories.
- Sets the working directory.
Plots Tab
- Displays graphs and charts.
- Allows for the export of plots.
Packages Tab
- Lists and manages R packages.
- Provides access to package documentation.
Help Tab
- Offers R documentation and help files.
- Useful for learning about R functions and packages.
Viewer Tab
- Displays local web content such as HTML files from R Markdown or Shiny apps.
Additional Features
- Toolbar: Quick access to common tasks like saving, loading, and running scripts.
- Customization: Ability to rearrange the layout of tabs and panes.
- Version Control: Integrated support for Git and SVN.
4.3 R Syntax and R Script
4.3.1 R Syntax
R is a powerful programming language used extensively for statistical computing and graphics. It provides a wide array of techniques for data analysis, including linear and nonlinear modeling, classical statistical tests, time-series analysis, classification, clustering, and more. Its syntax allows users to easily manipulate data, perform calculations, and create graphical displays. Here’s a breakdown of some fundamental aspects of R syntax and an example to illustrate how it works.
Basic Syntax Components
Variables: In R, you can create variables without declaring their data type. You simply assign values directly with the assignment operator
<-or=.Comments: Comments start with the
#symbol. Everything to the right of the#in a line is ignored by the interpreter.Vectors: One of the basic data types in R is the vector, which you create using the
c()function. Vectors are sequences of elements of the same type.Functions: Functions are defined using the
functionkeyword. They can take inputs (arguments), perform actions, and return a result.Conditional Statements: R supports the usual if-else conditional constructs.
Loops: For iterating over sequences, R provides
for,while, andrepeatloops.Packages: R’s functionality is extended through packages, which are collections of functions, data, and compiled code. You can install packages using the
install.packages()function and load them withlibrary().
4.3.2 R Script
- Rscript is a tool for executing R scripts directly from the command line, making it easier to integrate R into automated processes or workflows.
- It’s part of the R software environment, which is widely used for statistical computing and graphics. Rscript enables you to run R code saved in script files (typically with the
.Rextension) without opening an interactive R session. - This is particularly useful for batch processing, automated analyses, or running scripts on servers where a graphical user interface is not available.
Creating an R Script in RStudio
Creating and using R scripts in RStudio is a fundamental skill for anyone working with data in R. RStudio, being a powerful IDE for R, streamlines the process of writing, running, and managing R scripts. Here’s a concise guide based on insights from various sources:
Start a New Script: To begin, navigate to
File->New File->R Script. This opens a new script tab in the top-left pane where you can write your code.Writing Code: You can type your R code directly into this script pane. Common tasks include importing data, data manipulation, statistical analysis, and plotting. For instance, to create and print a variable, simply type something like
result <- 3followed byprint(result)to see the output in the Console pane.Running Code: To execute your code, you can click the
Runbutton at the top of the script pane, or use keyboard shortcuts (e.g.,Ctrl+Enteron Windows). The output will appear in the Console pane at the bottom.
Basic R Scripts Examples
Below are a few examples of basic R scripts that demonstrate common tasks in R.
Example 1: Hello World
A simple script that prints “Hello, World!” to the console.
Example 2: Basic Arithmetic
This script performs basic arithmetic operations and prints the results.
Example 3: Creating and Plotting a Vector
This example demonstrates how to create two numerical vectors, perform an operation on them, and then plot the result.
In this example:
- Two vectors,
vector1andvector2, are created using thec()function. - These vectors are then added together, resulting in the
resultvector. The addition is done element-wise: the first element ofvector1is added to the first element ofvector2, and so on. - Finally, the
plot()function is used to visualizeresult. Thetype = "o"argument specifies that both the points and the lines connecting them should be plotted, andcol = "red"changes the color of the plot to red.
These examples introduce the basics of writing and running R scripts with Rscript. As you become more familiar with R’s syntax and features, you can write more complex scripts to automate a wide range of data analysis and statistical tasks.
Summary
| Concept | Description |
|---|---|
| What R Is | |
| What R Is | Open-source language and interactive environment for statistical computing, data analysis, and graphics |
| Origins of R | Developed by Ross Ihaka and Robert Gentleman at the University of Auckland and maintained by the R Core Team |
| CRAN | Comprehensive R Archive Network, the central repository of community-contributed R packages |
| Platform Independence | Runs on Windows, macOS, and Unix-like systems, making the same code portable across operating systems |
| Installation and Setup | |
| Install R | Downloaded from the Comprehensive R Archive Network for the relevant operating system |
| Install RStudio | Integrated development environment from Posit that bundles console, editor, and viewers into one workspace |
| RStudio Panels | |
| Source Panel | Top-left pane for writing and editing R scripts and R Markdown documents with syntax highlighting |
| Console Panel | Bottom-left pane for executing R commands interactively and inspecting results and command history |
| Environment and History Panel | Top-right pane showing objects currently in memory and a log of commands previously executed |
| Files, Plots, Packages, Help, Viewer Panel | Bottom-right pane for files, plots, package management, help pages, and HTML viewer |
| R Syntax Essentials | |
| Assignment Operator | Uses `<-` or `=` to bind a value to a name, with `<-` preferred by convention |
| Comments | Everything after the `#` symbol on a line is ignored by R, useful for documenting intent |
| Vectors | One-dimensional sequences of values of the same type, created with the `c()` combine function |
| Functions | Reusable blocks defined with the `function` keyword that accept arguments and return a result |
| Conditional Statements | `if`, `else if`, and `else` control which branch of code runs based on a condition |
| Loops | `for`, `while`, and `repeat` iterate a block of code over sequences or until a condition changes |
| Packages | Collections of functions and data installed with `install.packages()` and loaded with `library()` |
| R Scripts and Execution | |
| R Script File | Text file with the `.R` extension that stores R code for reuse, sharing, and version control |
| Rscript Command Line Tool | Command-line tool that executes R scripts outside RStudio, useful for automation and batch jobs |
| Running Code in RStudio | Click Run in the script pane or press `Ctrl+Enter` (Windows) to send the current line to the console |